| > | restart; with(plots): with(plottools): |
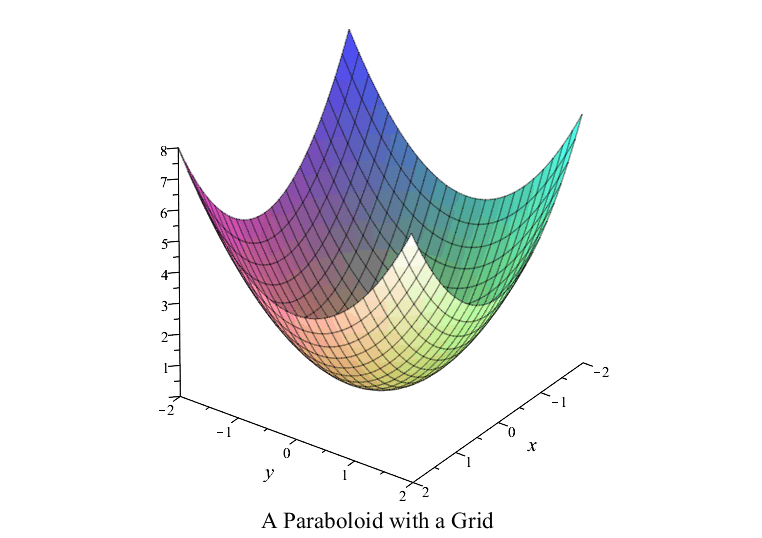
| > | f := x^2 + y^2 ; |
| f := x2 + y2 | (1) |
| > | plot3d( f, x = -2.0 .. 2.0, y = -2.0 .. 2.0, axes = framed, linestyle = solid, lightmodel = none, caption = "A Paraboloid with a Grid", captionfont = [TIMES, ROMAN, 18], labelfont = [TIMES, ROMAN, 16] ) ; |
 |
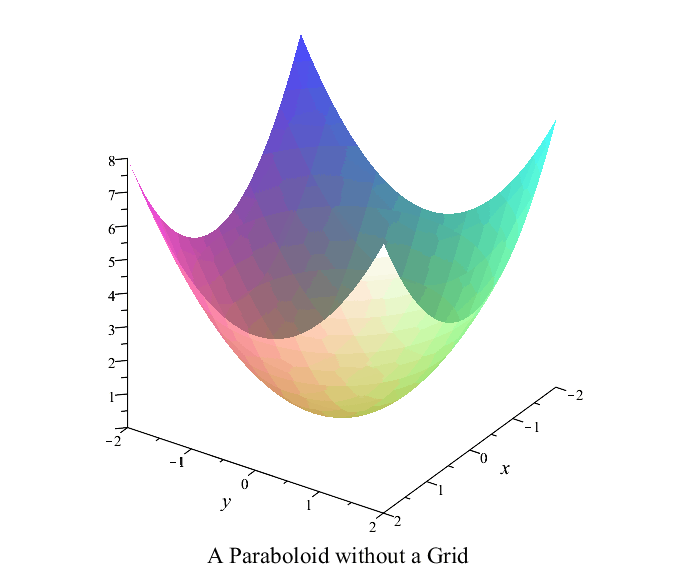
| > | plot3d( f, x = -2.0 .. 2.0, y = -2.0 .. 2.0, style = patchnogrid, axes = framed, linestyle = solid, lightmodel = none, caption = "A Paraboloid without a Grid", captionfont = [TIMES, ROMAN, 18], labelfont = [TIMES, ROMAN, 16] ) ; |
 |
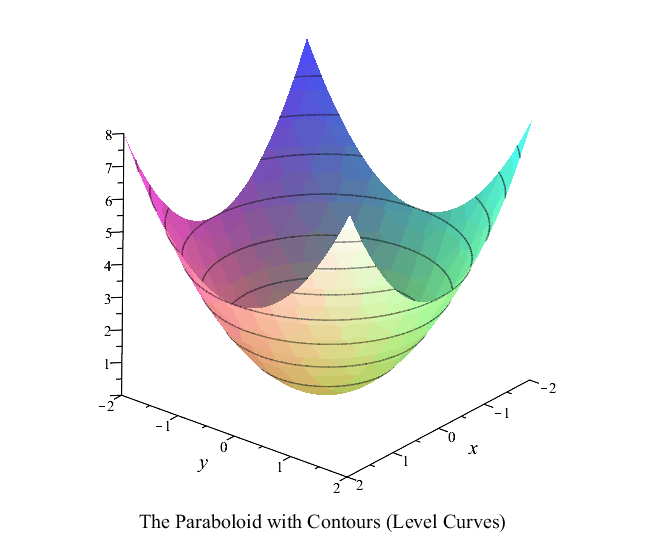
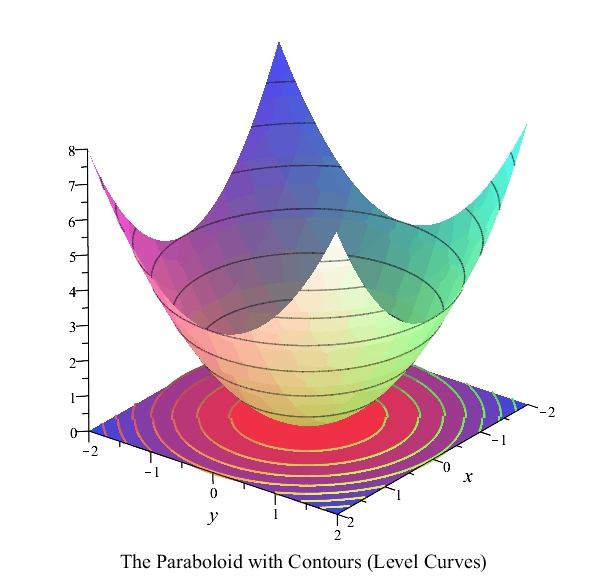
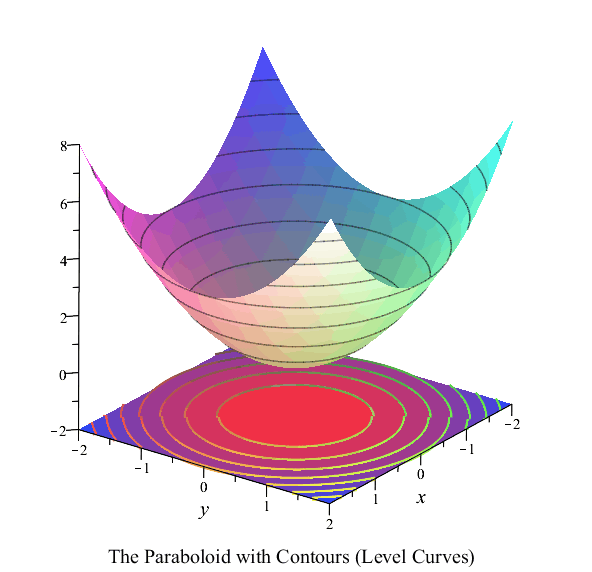
| > | surf := plot3d(f, x = -2.0 .. 2.0, y = -2.0 .. 2.0, style = patchcontour, contours = [1, 2, 3, 4, 5, 6, 7], axes = framed, linestyle = solid, lightmodel = none, caption = "The Paraboloid with Contours (Level Curves)", captionfont = [TIMES, ROMAN, 16], labelfont = [TIMES, ROMAN, 16] ) : |
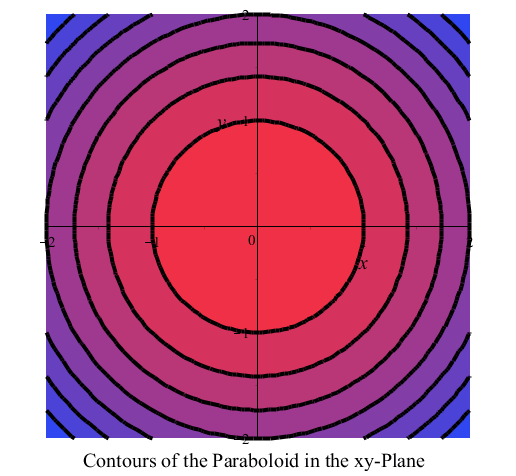
| > | Contours := contourplot( f, x = -2.0 .. 2.0, y = -2.0 .. 2.0, contours = [1, 2, 3, 4, 5, 6, 7], linestyle = solid, thickness = 4, caption = "Contours of the Paraboloid in the xy-Plane", captionfont = [TIMES, ROMAN, 16], labelfont = [TIMES, ROMAN, 16], filled = true ) : |
| > | display( surf ) ; |
 |
| > | display( Contours, scaling = constrained ) ; |
 |
| > | F := transform( (x, y) -> [x, y, 0] ) : display( { surf, F(Contours) } ) ; |
 |
| > | F := transform( (x, y) -> [x, y, -2] ) : display( { surf, F(Contours) } ) ; |
 |
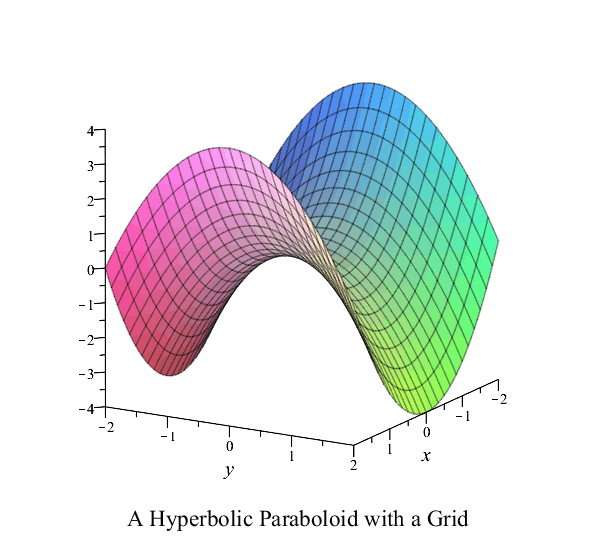
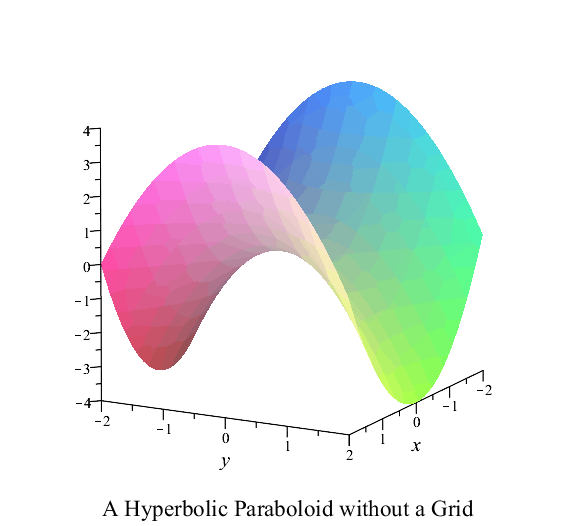
| > | f := x^2-y^2 ; |
| f := x2 – y2 | (2) |
| > | plot3d( f, x = -2.0 .. 2.0, y = -2.0 .. 2.0, axes = framed, linestyle = solid, lightmodel = none, caption = "A Hyperbolic Paraboloid with a Grid", captionfont = [TIMES, ROMAN, 18], labelfont = [TIMES, ROMAN, 16] ) ; |
 |
| > | plot3d( f, x = -2.0 .. 2.0, y = -2.0 .. 2.0, style = patchnogrid, axes = framed, linestyle = solid, lightmodel = none, caption = "A Hyperbolic Paraboloid without a Grid", captionfont = [TIMES, ROMAN, 18], labelfont = [TIMES, ROMAN, 16] ) ; |
 |
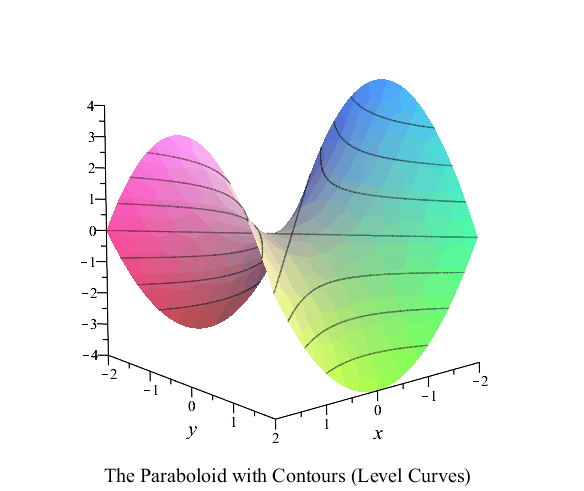
| > | surf := plot3d( f, x = -2.0 .. 2.0, y = -2.0 .. 2.0, style = patchcontour, contours = [-4, -3, -2, -1, 0, 1, 2, 3, 4], axes = framed, linestyle = solid, lightmodel = none, caption = "The Paraboloid with Contours (Level Curves)", captionfont = [TIMES, ROMAN, 16], labelfont = [TIMES, ROMAN, 16] ) : |
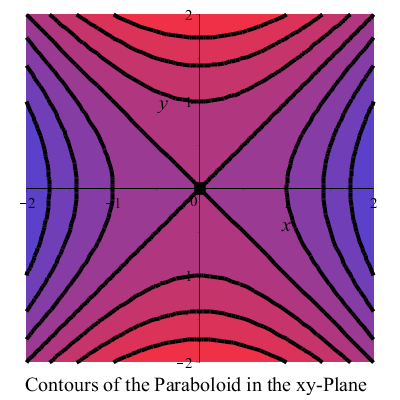
| > | Contours := contourplot( f, x = -2.0 .. 2.0, y = -2.0 .. 2.0, contours = [-4, -3, -2, -1, 0, 1, 2, 3, 4], linestyle = solid, thickness = 4, caption = "Contours of the Paraboloid in the xy-Plane", captionfont = [TIMES, ROMAN, 16], labelfont = [TIMES, ROMAN, 16], filled = true ) : |
| > | display( surf ) ; |
 |
| > | display( Contours, scaling = constrained ) ; |
 |
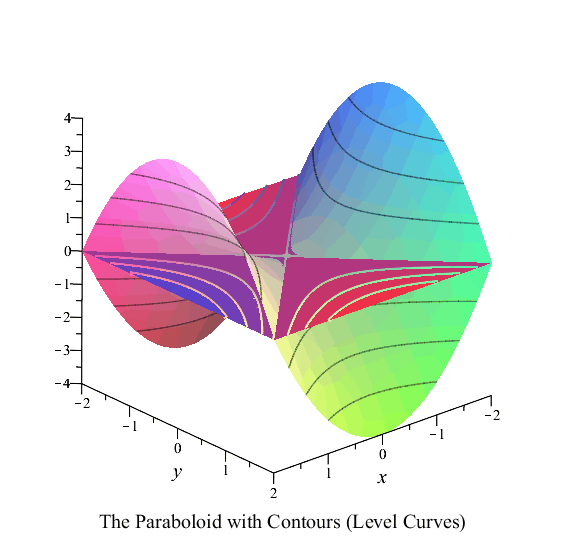
| > | F := transform( (x, y) -> [x, y, 0] ) : display( { surf, F(Contours) } ) ; |
 |
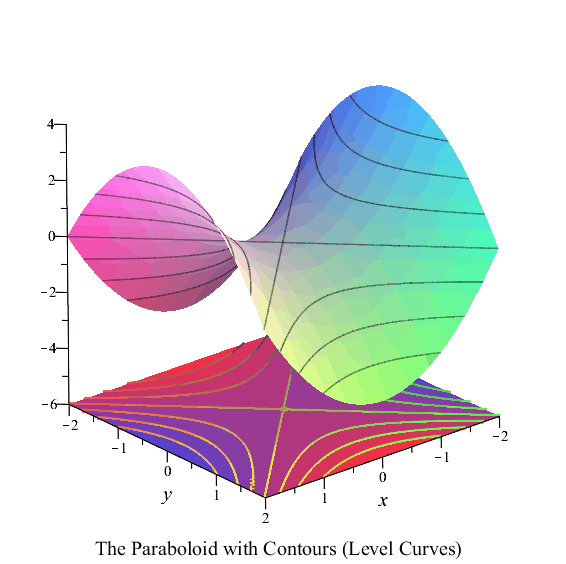
| > | F := transform( (x, y) -> [x, y, -6] ) : display( { surf, F(Contours) } ) ; |
 |